Online Degree Blog

WGU D468 OA Study Guide – 2025

WGU D468 OA Study Guide - 2025 | Mastering Data: From Life Cycles to SMART Goalsđź“–

Data is everywhere. The infrastructure supporting technological functions appears in advertisements on your screen together with applications you use alongside strategic business choices that occur daily. How can we transform vast data quantities into valuable actionable information? That’s where today’s journey begins. In this article, we’re diving into three powerful concepts that will change the way you think about data:

  1. Data Life Cycle: The series of stages through which data passes, from its initial collection and storage to its eventual archiving or deletion. The data life cycle is crucial for managing data effectively, ensuring data integrity, and maintaining security throughout its use.

  2. 6 Phases of Data Analysis: A structured approach to data analysis that includes six key stages: Ask (defining the question), Prepare (collecting and cleaning data), Process (organizing and structuring data), Analyze (applying statistical or computational methods), Share (communicating insights), and Act (making data-driven decisions).

  3. SMART Framework: A method used to guide goal-setting, ensuring that objectives are Specific, Measurable, Achievable, Relevant, and Time-bound. This framework is widely used for setting clear and realistic goals in both personal and organizational contexts.

Our guide provides comprehensive coverage of data operations including organizational information flow analysis, data breakdown procedures, and goal definition techniques. When you reach the end of this article you will gain comprehension of these concepts together with practical knowledge to tackle WGU D468 OA questions with assurance.

Let’s get started—because data might just be the superhero you didn’t know you needed.

How to Use This Guide for the WGU D468 OA Exam?đź“ť

The D468 Discovering Data OA exam at WGU evaluates your understanding of data management, data analysis processes, and goal-setting frameworks. This guide simplifies the key concepts of the data life cycle, the 6 phases of data analysis (ask, prepare, process, analyze, share, and act), and the SMART framework to help you grasp the topics tested in the exam.

We also provide exam-style questions and practical applications to ensure you’re fully prepared for the questions on the WGU D468 OA exam.

Need Guaranteed Results?

Visit OA Exams for Free 250+ WGU D468 Questions & Answers!

Understanding the Data Life Cycle For D468 OAđź“ť

Modern digital society depends on data as its essential foundation. Data takes a central role in every online shopping experience and fitness tracking system along with all business trend analysis. You may have wondered about the management processes that data undergoes starting from creation until complete deletion. The sequence that turns data from raw material into information product is known as data life cycle and learning to navigate it leads to maximum data potential.

What Is the Data Life Cycle?

The data life cycle is a series of stages that data goes through during its existence, from its creation to its eventual deletion. Think of it as the “story” of data. These stages ensure that data is handled properly, used effectively, and secured throughout its life. Although different organizations may describe the stages slightly differently, the core principles remain the same. Let’s dive into each stage.

1. Data Generation

This is where the story begins. Data is created from various sources, such as customer interactions, business transactions, IoT devices, or even social media activity. Imagine a fitness tracker on your wrist that records your steps—that’s data being generated! This stage is critical because the quality of data here impacts all later stages.

Key Point:

Data must be relevant, accurate, and collected with purpose. Starting with high-quality data means better insights down the line.

2. Data Collection

Data collection starts when information is created. During this phase decision makers choose essential data assets which are obtained through both human-generated methods (surveys) along with automated platforms (sensors and software logs). During this process, a business receives customer feedback from its website forms.

Why It’s Important:

Proper collection ensures that you’re only gathering data that serves a purpose. Collecting unnecessary or irrelevant data can lead to wasted storage and resources.

3. Data Processing

Once data is collected, it often arrives in a raw, unorganized state. This stage involves cleaning the data—removing duplicates, correcting errors, and organizing it into a format suitable for analysis. Think of it like washing vegetables before cooking. For example, removing typos or formatting inconsistencies from a spreadsheet ensures accurate results.

Fun Fact:

Data processing makes data more usable and trustworthy. Without this step, analysis could lead to incorrect conclusions.

4. Data Storage

Now that the data is cleaned and ready, it needs to be stored securely. Data storage involves keeping the information in databases, cloud services, or physical servers. It also includes implementing security measures like encryption to protect sensitive data.

Real-Life Example:

A bank storing transaction details on secure servers ensures customer privacy while keeping the data accessible for future use.

Note:

Efficient storage can help reduce costs by organizing data based on its importance. Frequently used data can be stored in fast-access systems, while older, less critical data can be archived in slower, cheaper storage.

5. Data Management

Data management includes effective systems for shaping and keeping data intact across time spans. The objective of this phase is to deliver accessible data per user permissions while securing it against unauthorized users.

Why It Matters:

Proper data management supports smooth business operations. For example, it ensures that a customer’s billing information is always up-to-date and correct.

6. Data Analysis

This is where data becomes truly powerful. In the analysis stage, businesses use tools and techniques to interpret data and extract valuable insights. For example, analyzing customer purchase patterns can help predict future trends or optimize marketing strategies.

Did You Know?

Advanced tools like machine learning and AI can uncover hidden patterns in data, leading to better decision-making.

7. Data Visualization and Interpretation

The results of data analysis must present themselves as easily comprehensible information. The analysis results appear through visualization tools such as dashboards graphs and charts. The communication of data findings constitutes the foremost task during this stage.

Example:

A sales team might use a graph to show how monthly revenue has increased, making it easier for decision-makers to act on the data.

Why Does the Data Life Cycle Matter?

The data life cycle is essential for effective data management, helping organizations:

  • Maintain data quality and reliability.
  • Reduce costs by storing data efficiently.
  • Ensure data security and compliance with laws.
  • Extract maximum value from data for decision-making.

Whether you’re a student exploring data analysis or a business professional managing databases, understanding the data life cycle ensures you handle data responsibly and efficiently. This knowledge is a foundational step in mastering concepts covered in WGU D468 OA questions and excelling in data-driven decision-making.

Organizations that follow the data life cycle stages successfully combine optimal data value extraction with risk reduction strategies. Moving forward we will examine data analytical phases as an essential method to derive meaningful insights beyond data analytical boundaries in contemporary data-focused environments.

Struggling with WGU D468 OA?

View our WGU D468 “How to Pass” Article Here!

The Six Phases of Data Analysis For D468 OAđź“ť

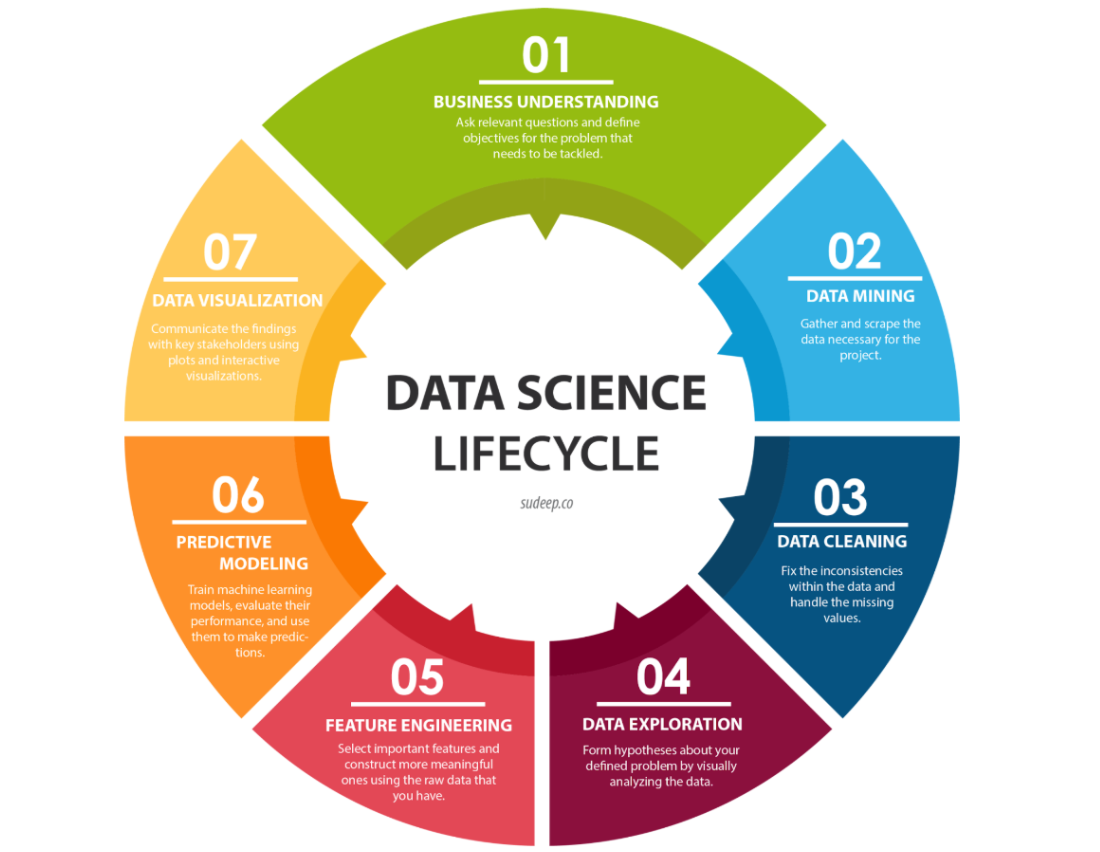
Have you ever wondered how businesses figure out what’s working and what isn’t? Behind every smart decision lies a powerful process: data analysis. But data analysis isn’t a single step—it’s a journey made up of six essential phases. These phases help organizations make sense of information and use it to improve results. Let’s explore them one by one.

1. Ask: Defining the Right Questions

Every analysis begins with a question. But not just any question—it must be clear and purposeful. This phase is about understanding what problem needs solving. To do this, you collaborate with stakeholders, identify their needs, and define the questions that guide your analysis.

For example:

  • Why are sales decreasing in a particular region?
  • What factors influence customer satisfaction?

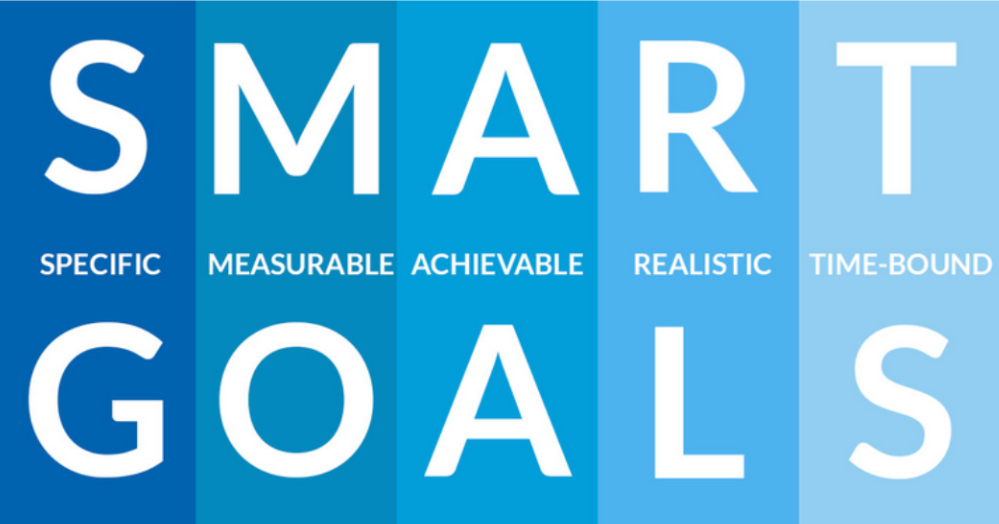
The best questions follow the SMART criteria:

  • Specific: Focused and detailed.
  • Measurable: Can be quantified.
  • Achievable: Realistic to answer.
  • Relevant: Tied to business goals.
  • Time-bound: Linked to a specific timeframe.

2. Prepare: Collecting and Organizing Data

Once you know what to ask, it’s time to gather the data you need. This involves locating reliable sources, generating data, and organizing it for easy access.

Real-world examples:

  • A retail company gathers sales data from its website, CRM system, and marketing platforms.
  • A hospital collects patient information like medical history and demographic details.

In this phase, it’s also essential to understand the data ecosystem—how different data sources connect and interact.

3. Process: Cleaning and Structuring Data

Raw data is like a messy pile of papers. It’s full of errors, missing values, and inconsistencies. In this phase, you clean and structure the data to make it usable. This is where you:

  • Remove duplicates.
  • Correct errors (e.g., fixing typos).
  • Standardize formats (e.g., dates).
  • Fill in missing information where possible.

Imagine preparing ingredients before cooking—this phase ensures your data is ready for analysis.

4. Analyze: Finding Patterns and Insights

Now comes the exciting part! During this phase, you use the data to discover patterns and trends as well as important findings. The analysis includes three possible methods such as statistical analysis, machine learning, and predictive modeling. The conversion of unprocessed data into beneficial information remains the objective.

For example:

  • A retail company might discover which products sell best during specific seasons.
  • A hospital might identify factors that increase patient readmission rates.

Tools like Excel or SQL are commonly used in this phase to organize and interpret the data.

5. Share: Communicating Results

Data isn’t useful if it’s not shared effectively. In this phase, you present your findings to stakeholders using clear visuals, reports, and presentations. Think of it as telling a story with your data.

Key techniques include:

  • Data storytelling: Explaining insights in a compelling way.
  • Visualization tools: Using graphs, charts, and dashboards to make data easier to understand.

Example:

  • A company presents a dashboard showing how marketing campaigns impact sales.
  • A hospital shares findings on patient care improvements with its staff.

6. Act: Making Data-Driven Decisions

The final phase is where the action happens. Based on the insights, stakeholders make informed decisions to address the original question.

For example:

  • A business might adjust its marketing strategy based on customer behavior trends.
  • A hospital might implement new procedures to reduce patient readmissions.

This phase is also the starting point for the next cycle of analysis. New questions arise, and the process begins again.

Why Are These Phases Important?

The six phases of data analysis aren’t just steps—they’re a framework that ensures data is used effectively. Each phase plays a critical role:

  • Ask ensures the process has a clear purpose.
  • Prepare and process to ensure data quality.
  • Analyze uncovers insights.
  • Share ensures those insights are communicated.
  • Act turns insights into real-world results.

Mastering these phases will prepare you to tackle challenges like the ones in WGU D468 OA questions and beyond.

Practical Examples of the Six Phases

Let’s bring this to life with real-world examples:

  • Retail: A company asks why sales are declining. They gather data from their website and CRM (prepare), clean it (process), analyze trends (analyze), create a report (share), and adjust their marketing strategy (act).
  • Healthcare: A hospital asks how to reduce patient readmissions. They collect patient data (prepare), clean it (process), identify risk factors (analyze), present findings (share), and implement new discharge protocols (act).

Importance  For the D468  OA

Understanding the six phases of data analysis helps you see the bigger picture of how data is used to solve problems. Whether you’re analyzing sales trends, improving healthcare, or answering WGU D468 OA questions, this framework provides a clear path to success. By mastering these steps, you can turn data into decisions and create a real impact in any field.

Tired of reading blog articles?

Let’s Watch Our Free WGU D468 Practice Questions Video Below!

Understanding the SMART Framework For D468 OAđź“ť

The actual process of reaching targets proves to be more difficult than goal development. That’s a whole different story. The SMART framework provides a necessary structure through its five components which stand for Specific, Measurable, Achievable, Relevant, and Time-bound. No matter if you pursue school work or business solutions this tool helps you express your goals while making them action-focused and connected to your targets. A thorough explanation will follow.

What Is the SMART Framework?

The SMART framework is a method for setting goals that help ensure your efforts lead to meaningful outcomes. Instead of vague or overly ambitious goals, SMART encourages precision and practicality. Imagine this:

Instead of saying, “I want to improve sales,” a SMART goal would be, “I want to increase the conversion rate of landing page A from 2% to 5% within three months.” This specificity makes it easier to track progress and stay focused.

Each component of SMART works together to create a clear and actionable plan. Let’s explore each part.

Breaking Down SMART

The SMART framework uses five critical elements to ensure success:

1. Specific: Be Clear About What You Want

Goals should be specific and unambiguous. The more detailed your goal, the easier it is to focus your efforts. For example, compare these two goals:

  • Vague: “Increase website traffic.”
  • Specific: “Increase website traffic by 20% through blog posts and social media campaigns.”

A specific goal answers questions like:

  • What am I trying to accomplish?
  • Why is this goal important?
  • Who is involved?

When goals are specific, everyone understands the direction.

2. Measurable: Track Your Progress

A measurable goal includes criteria to evaluate progress. Numbers make it easier to see whether you’re on track or need adjustments. For instance:

  • Example: “Improve the conversion rate of landing page A from 2% to 5%.” Here, the measurable metric is the conversion rate.

Tracking your progress keeps you motivated and helps identify areas for improvement. Consider tools like graphs or progress charts to visualize your metrics.

3. Achievable: Set Realistic Goals

While it’s good to aim high, your goals should also be realistic. Setting unattainable goals leads to frustration. Ask yourself:

  • Do I have the resources to achieve this?
  • Is this goal within reach given the current constraints?

For example:

  • Unrealistic: “Double sales overnight.”
  • Achievable: “Increase sales by 10% over the next quarter.”

Balancing ambition with realism is key.

4. Relevant: Align Goals With Broader Objectives

Your goals should align with your overall priorities. Relevance ensures you’re focusing on what truly matters. For instance:

  • Relevant: “Improve conversion rates on a high-traffic product page.”
  • Irrelevant: “Spend time redesigning a page with no traffic.”

A relevant goal answers questions like:

  • Does this align with my business or personal objectives?
  • Is this the right time to pursue this goal?
5. Time-bound: Set a Deadline

A goal without a deadline is just a dream. Adding a timeframe creates urgency and keeps you focused. For example:

  • Example: “Complete the analysis and implement changes within three months.”

Deadlines help you prioritize tasks and measure progress effectively. Using milestones can make long-term goals feel more manageable.

How the SMART Framework Applies to Data Analysis

The SMART framework isn’t just for goal-setting; it’s also a powerful tool in data analysis. For example, let’s say a company wants to improve its customer retention rate. Using SMART, the goal could look like this:

SMART Element Goal Example
Specific
Reduce customer churn by addressing complaints
Measurable
Decrease churn rate from 15% to 10%
Achievable
Use feedback surveys to identify top issues
Relevant
Aligns with revenue growth goals
Time-bound
Achieve the goal within six months

By framing data analysis goals with SMART, organizations ensure every insight is actionable and contributes to meaningful change.

Why Is the SMART Framework Important?

The SMART framework isn’t just a buzzword—it’s a proven method for turning plans into action. Here’s why it works so well:

  • Clarity: It removes ambiguity by defining clear goals.
  • Focus: It ensures efforts are directed toward what matters most.
  • Accountability: Measurable goals make it easier to track progress and evaluate success.
  • Efficiency: It prevents wasted time and resources on irrelevant tasks.

For students tackling WGU D468 OA questions, using SMART can make complex data analysis tasks more manageable and focused.

Practical Examples

Here are a few real-world applications of SMART goals:

  • Marketing: A company sets a SMART goal to increase social media followers by 20% within three months by posting daily content and engaging with users.
  • Education: A teacher creates a SMART goal to improve student test scores by 15% by implementing weekly practice quizzes.
  • Healthcare: A hospital aims to reduce patient readmission rates by 5% in six months by improving discharge protocols.

By making goals specific and measurable, teams across industries achieve better results.

Importance  For the D468  OA

The SMART framework is more than a tool—it’s a mindset for setting and achieving goals. Whether you’re a business analyst, a student in the Discovering Data (WGU D468) module, or someone aiming to hit personal milestones, SMART can guide you toward success. By following this framework, you’ll not only reach your goals but do so with clarity and purpose. Using tools like tables, charts, and step-by-step approaches can make the application of SMART even more effective and engaging.

Struggling with WGU D468 OA?

View our WGU D468 “How to Pass” Article Here!

Grasping Data Concepts for WGU D468 Successđź“„

As we wrap up, remember that the Data Life Cycle, the Six Phases of Data Analysis, and the SMART Framework are essential tools for mastering data. These concepts form the foundation for success in both real-world applications and the WGU D468 OA. By focusing on understanding and applying these frameworks, you’ll be ready to tackle your assessments and beyond.

Prepare well, practice thoroughly, and don’t forget to review key ideas. Each step you take brings you closer to acing your Objective Assessment. Good luck, future data wizards—go show that test who’s boss!

Don't want to study?

Reach Us For Guaranteed Exam Support and Pay-After-You-Pass!

Leave a Reply

Your email address will not be published. Required fields are marked *