Hello, fellow WGU student! Welcome to our guide on how to excel in the Data-Driven Decision Making WGU C207 OA. We’ve conducted thorough research to bring you the most essential information you need to pass this course’s OA with confidence. By reading this guide, you’ll gain insights into the key concepts and topics to prioritize, the study methods to adopt, and also advice from previous course takers for your convenience. We trust that this information will help steer you toward success on your academic journey. So, let’s dive into our study guide. Happy learning!
...
About the Data-Driven Decision Making WGU C207 OA 📖
Dive into the universe of productive solutions for businesses that will boost your organizational effectiveness and crunch any challenge! This module is all geared up to mentor you with all the best tools and techniques – right from the field research work to data analysis as a professional. This module will cover everything in quantitative analysis, statistics tools, and quality tools that you will need to navigate easily as you decide about these significant issues.
The list of competencies you will go through in this module is as follows:
- The Case for Quantitative Analysis: Develop strategies for organizational decision processes (17%)
- Statistics as a Managerial Tool: Evaluate alternatives using decision-analysis tools. (21%)
- More Statistical Tools: Utilize quantitative techniques and statistical tools to identify appropriate decision alternatives. (13%)
- Quality Metrics and Tools: Apply quality metrics and tools to increase efficiency, effectiveness, and quality. (20%)
- Real World Data-Driven Decisions: Analyze data from business intelligence and knowledge-management systems for decision-making. (17%)
- Improving Organizational Performance: Use data to enhance the performance of your organization. (11%)
These topics will provide you with all the knowledge you need to be an effective decision-maker in your career.
The course is credited with both an Objective Assessment and a Performance Assessment. In this particular article, we will discuss only the Objective Assessment (OA) section of the course.
...
About WGU C207 OA📝
The Objective Assessment (OA) for this module consists of 70 questions that you’ll need to answer within a time limit of 200 minutes. All questions in the OA are derived from the ETextBook (MindEDge) provided by WGU. It’s important to note that while the Pre-Assessment may be straightforward, the OA is more complex and scenario-based. Therefore, thorough understanding of the course material is essential for success in the OA.
Topics to focus in Data-Driven Decision Making WGU C207 OA📝
As you go through the study material for this module, focus your attention on the following key concepts and topics. Our research indicates that the majority of OA questions are derived from these areas:
Bell Curve
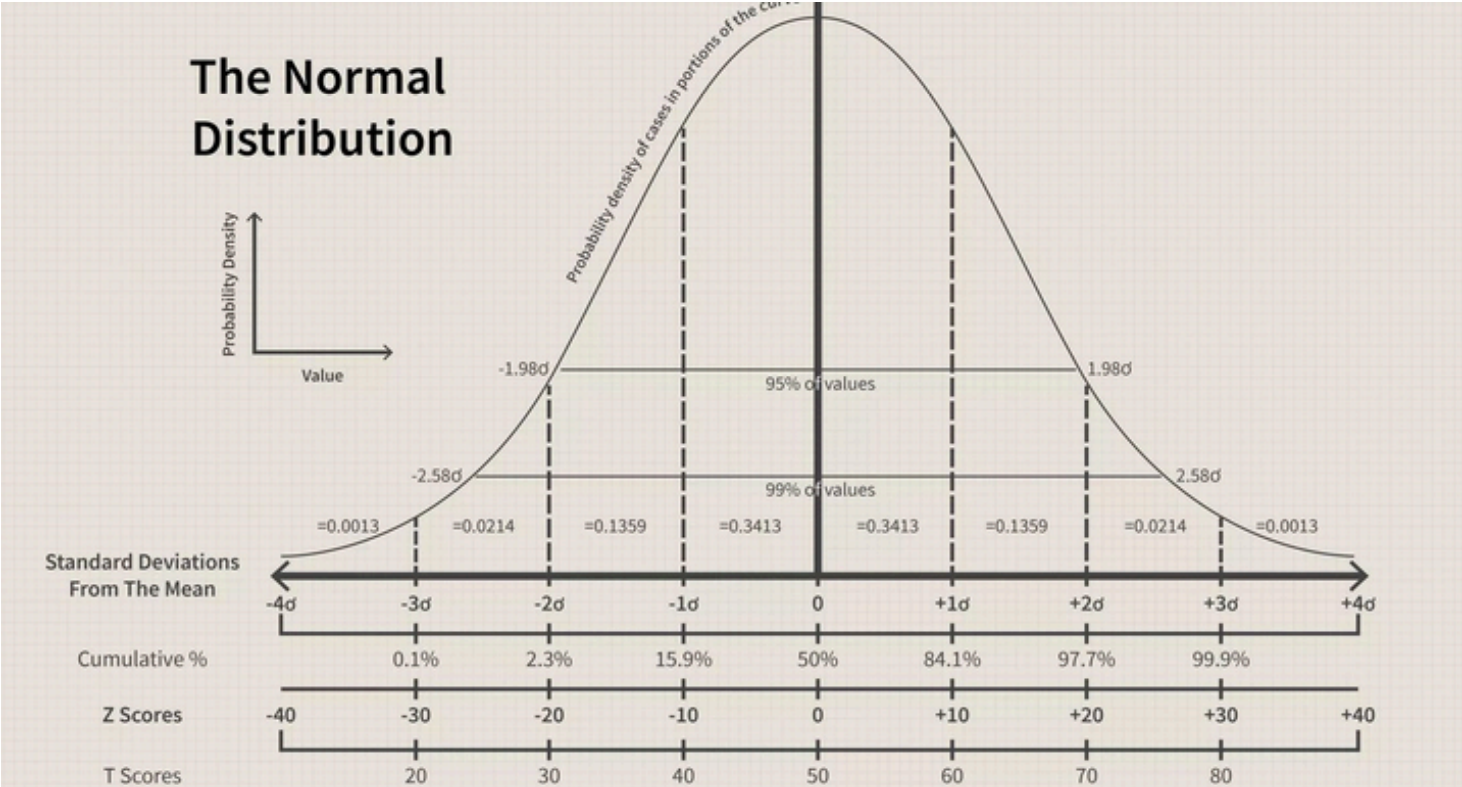
The concept of “bell curve” usually visualizes normal distribution, a statistical theory describing the distribution of data within a dataset. The curve is also known as the normal curve which is named after its symmetrical, bell-shaped form when plotted as a graph. Here, the vast majority of data points lie in the neighborhood of the average (the mean) whereas the few data points residing in the far distant range make up the tails of the curve.
The knowledge of the bell curve is crucial in the data-ensemble strategy, as it has been observed that many instances of the live experience and human nature tend to be similar to the distribution law called the bell curve. For instance, bell shape is usually observed during the distribution analysis of academic achievements of a relatively big population. This therefore, implies that the best majority of the people would be mediocre because only a smaller number of individuals excel incredibly, while others fall behind the average.
With data-driven decision-making, viewing the bell curve helps decision-makers interpret datasets in an accurate manner, see outlier occurrences, anticipate the probabilities, and make well-informed decisions based on statistical analyses. It acts as the base for a lot of statistical techniques and models that are made to analyze data and decode information for the optimization of the organizational strategies, allowing straightforward and effective plans of action.

Standard Deviation
Standard deviation is a key statistical measure that quantifies the dispersion or spread of data points in a dataset relative to the mean or average value. It provides valuable information about the variability or consistency of the data.
Values with lower standard deviations generally suggest that the data points are near the mean, exhibiting less variability or consistency. Alternatively, a high standard deviation means a higher level of variation or inconsistency among data points as they are more spread out from the mean.
Standard deviation is the essential feature that allows decision-makers to check the reliability and stability of data. Why? Because it is used in data-driven decision making. For instance, during the quality control measures, unitary manufacturing leads to low standard deviations of product measurements, while high standard deviations could mean the inconsistency of the process and the need for corrective actions among the workers.
Also, standard deviation is used together with the mean frequently to form intervals of confidence and to test the significance of differences in datasets. This serves as the most basic tool to understand the distribution of data, identify the outliers and finally to make an informed decisions out of various static analyses.

Mean: The mean which is also known as the average, is calculated by summing up all the values in a dataset and then dividing by the total number of values in the dataset. It represents the average value for the dataset, and it is sensitive to the extreme values and outliers. The mean is one of the most frequently employed devices when the data is either abiding by a normal distribution, or when the spread of the data does not have any extreme outliers that affect the data at large.
- The mean is calculated by summing up all the values in a dataset and dividing by the total number of values.
- Formula:

- xi- represents each individual value in the dataset.
- n – represents the total number of values in the dataset.
Median: Median is an average value in a dataset that displays the middle value after the whole data is organized into an ascending or descending order. The median can be derived from the dataset having an odd number of values, and such is the middle value itself. If the dataset comprises of an even number of values, the median is a combination of these two values located in the middle of the dataset. The median is robust to outliers and extreme values and provides a measure of central tendency that is less affected by skewed distributions.
- The median is the middle value in a dataset when the values are arranged in ascending or descending order.
- Formula (for odd number of values):

- Formula (for even number of values):

- n – represents the total number of values in the dataset.
Mode: Mode is something different from the arithmetic mean and median. A mode can also be used for nominal data in addition to numerical data. If a data set have 2 or more modes it is commonly called multimodal. A range of studies can be conducted with the distribution frequency mode identifying the most often occurring value. In this area the distribution frequency is associated with the most important role.
- The mode is the value that appears most frequently in a dataset.
P-value:
The P-value indicates the probability of observing the data or more extreme results, assuming the null hypothesis is true. It helps determine the significance of results obtained from hypothesis tests.
P-Value depends on the statistical test being performed (e.g., t-test, chi-square test, etc.). In general, it represents the probability of observing the data or more extreme results under the assumption that the null hypothesis is true.
R-square:
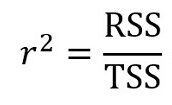
R-square quantifies the proportion of variance in the dependent variable explained by the independent variables in a regression model. It ranges from 0 to 1, with higher values indicating better fit.
The formula for calculating R-square in a regression analysis is:

- SSR – is the sum of squares of the regression (explained sum of squares).
- SST – is the total sum of squares.
Z-score:
The Z-score measures how many standard deviations a data point is from the mean of the dataset. It helps standardize data, identify outliers, and compare different datasets or observations.
The formula for calculating the Z-score of an individual data point x in a dataset with mean μ and standard deviation σ is:

- x – is the individual data point.
- μ – is the mean of the dataset.
- σ – is the standard deviation of the dataset.
...
External Resources 📂
When preparing for the Objective Assessment (OA), you can utilize the following external resources as supplementary guides to enhance your understanding and readiness for the exam:
- Quizlets can help you assess your knowledge in each topic you have gone through and retain the information better. Try to go through the Quizlet and test your knowledge
Quizlet – WGU C207 Data Driven Decision Making Quizlet - There are many educational channels and videos on YouTube covering data-driven decision-making, statistics, and related topics. We have listed some of these channels below.
Youtube Video – Standard Normal Distribution Tables, Z Scores, Probability & Empirical Rule
Youtube Channel – StatQuest with Josh Starmer
...
What Study Plan to Follow for the Data-Driven Decision Making WGU C207 OA?
- Day 1: Course Material (EtextBook) + Video Library
For Step One of the study plan for C207, we recommend beginning with the “MindEDge” ETextBook provided by WGU for the module. This textbook forms the foundation of your knowledge for the exam, as all OA questions will be based on its content. After completing each chapter, reinforce your learning by watching the relevant video in the module’s video library.
While studying, pay close attention to the following topics, as they are significant for the OA and may feature prominently in exam questions:
- Mean, Median, Mode: Understand these measures of central tendency and their applications in data analysis.
- Data Types: Familiarize yourself with different data types, such as categorical and numerical, and their characteristics.
- Analysis and Test Types: Learn about various analysis and testing methods used in data-driven decision-making processes.
- Bell Curve and Standard Deviation: Understand the concepts of normal distribution, bell curve, and standard deviation, and their relevance in statistical analysis.
- P-value, R-square, and Z-score: Differentiate between these statistical measures and comprehend their significance in hypothesis testing and regression analysis.
- Quality Assurance vs. Quality Control: Differentiate between these two approaches to ensuring product or service quality.
- Chart Types: Explore different types of charts and graphs used to visually represent data.
- KPI, NPS, and Balanced Scorecard: Understand these performance measurement tools and their role in assessing organizational effectiveness.
- Bayes/Combination/Addition/Multiplication Theory: Gain familiarity with probability theory concepts and their applications in decision-making processes.
By focusing on these topics and integrating them into your study plan, you’ll be better prepared to tackle the OA and demonstrate your understanding of key concepts in Data-Driven Decision Making.
- Day 2: Calculations + Quizlets
Once you’ve completed the course content, it’s essential to review and reinforce your understanding of the formulas and calculations covered. Unlike other modules, the Data-Driven Decision Making C207 OA does not provide a formula sheet during the exam. Therefore, it’s crucial to memorize the important formulas to ensure success.
Based on feedback from past students, the following calculations are likely to appear in the OA:
- Z-score
- Solving a linear equation for y
- Simple probability
- Multiplication rule for probability
- Simple index
- Mean, median, mode
- Interquartile range (study box graphical representation of IQR)
- Net Promoter Score (NPS)
Remember that the OA will feature situation-based questions, so it’s essential to comprehend the concepts behind the formulas rather than merely memorizing them. Understanding the underlying principles will enable you to apply the formulas effectively to solve problems encountered in real-world scenarios.
After reviewing the material mentioned above, we highly recommend exploring the Quizlets provided in the external resources section of this article. These Quizlets have been carefully curated to reinforce the knowledge you’ve gained throughout your study journey. By engaging with these interactive study tools, you’ll have the opportunity to test your understanding, review key concepts, and solidify your grasp of the course material.
- Day 3: PA + Coaching guide
Now that you’ve gone over the course material again, you’re ready to take on the Pre-A. Take your time to get ready for the pre-assessment, especially in areas where you might feel less sure. Use the study tips and resources we’ve suggested to help you prepare. When you’re taking the pre-assessment, give it your all in every question. Your performance in the pre-assessment will show you how ready you are for the Objective Assessment (OA) and help you plan your final study time.
After completing the Pre-A, an auto-generated Coaching report will summarize your performance. This report will highlight your areas of weakness, allowing you to focus your revision efforts accordingly before attempting the OA. If you didn’t pass the Pre-A, don’t worry—take the exam again. It’s crucial to pass the Pre-A before attempting the OA. Keep studying and stay determined!
- Day 5: OA
It is finally time to take on the OA. You have proved to yourself that you can ace the Pre-A and now you have the validation to go through the OA. Trust in the skills you’ve acquired, and the preparation you’ve done. . Sit for the OA with a positive attitude, knowing that you’ve done all the necessary work and you have all the tools ready for the triumph. Put your best foot forward and always keep in mind that your abilities will see you through.
...
Conclusion 📄
In conclusion, successfully becoming a data-driven decision maker in WGU C207, requires commitment, endurance and careful planning. By practicing the outlined plan of study, implementing the recommended materials, and applying the positive mind-set, you can overcome difficulties and handle the Pre-Assessment and Objective Assessment successfully. What is crucial is the fact that one can not pass exams just by memorizing the items, but rather, one should know how to use them in the world outside of the academics. However with patience and strong will, you will not only get through this module, but also be able to harness all the tools that will help you succeed in your academics and your career. So keep your focus and motivation level up and always trust that you can accomplish success in the Data-Driven Decision Making course.
...


