
WGU D491 OA Study Guide - 2025 | Mastering Data Analytics Techniques and ARIMA Models 📖
Data analytics exists in a world where numerical values serve as the crucial ingredient to discovering vital business knowledge. The WGU D491 coursework demands more than basic spreadsheet examination despite its apparent simplicity (no matter how enjoyable that task might be). Pattern identification combined with prediction abilities turns an organization into a data wizard they never realized they required.
In this article, we’ll take you through three essential topics that will turn you from a beginner to a data-savvy pro.
- The Data Analytics Lifecycle: This lifecycle includes stages like data collection, data cleaning, data analysis, and data visualization, all aimed at deriving actionable insights from raw data.
- Data Analytics Techniques: Various techniques such as regression analysis, clustering, classification, and time-series analysis are used to analyze and interpret complex datasets, helping to make informed decisions.
- ARIMA Model: The ARIMA (AutoRegressive Integrated Moving Average) model is a statistical method used for forecasting time-series data, focusing on past data trends to predict future values.
This guide will provide you with solutions for WGU D491 OA questions and will make you value the impact that data can bring. Ready to unlock those insights? Let’s get started!
How to Use This Guide for the WGU D491 OA Exam?📖
The D491 Introduction to Analytics OA exam at WGU evaluates your understanding of data analysis processes, statistical techniques, and forecasting models. This guide simplifies the key concepts of the data analytics lifecycle, data analytics techniques, and the ARIMA model to help you grasp the topics tested in the exam.
We also provide exam-style questions and practical applications to ensure you’re fully prepared for the questions on the WGU D491 OA exam.

The Data Analytics Lifecycle: A Step-by-Step Guide For D491 OA📝
A structured data analytics process enables professionals to transform raw data into meaningful information through a complete workflow starting from initial data assessment until results deliverable generation. The procedure enables businesses to grasp their data patterns which leads to better decision making.
We will examine each phase of the Data Analytics lifecycle during this article as we explain their value alignment and operational interaction that helps organizations become data-based decision-makers.
What is the Data Analytics Lifecycle?
A sequential data processing method known as The Data Analytics Lifecycle helps professionals convert raw data types into meaningful organizational insights. Data professionals can utilize the blueprint to achieve effective data collection and clean-up and analysis for business objective achievements.
The lifecycle follows an iterative nature because it continues without interruption. The analysis phases have to be repeated numerous times by data analysts when they both adjust for new data or evolving business needs and refine their methods.
The 6 Phases of the Data Analytics Lifecycle
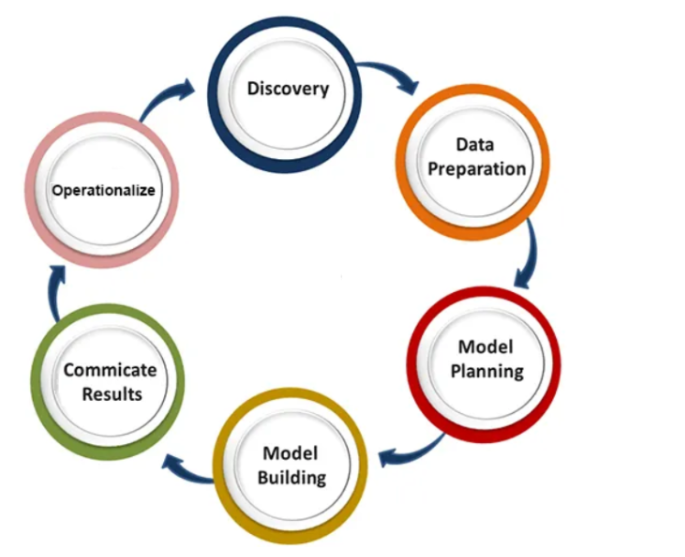
Let’s break down the six main phases of the lifecycle:
1. Discovery
- What it is: The first step focuses on understanding the business problem that needs to be solved. It’s all about defining what you are trying to achieve and setting clear goals.
- Key activities:
- Identify the business problem
- Define the scope of the project
- Set objectives and understand the context
- Determine relevant data sources
2. Data Preparation
- What it is: This phase is all about gathering, cleaning, and organizing the data. Raw data is often messy and needs to be cleaned up before analysis.
- Key activities:
- Collect and organize data from different sources
- Handle missing or incorrect data
- Normalize and format the data to ensure it’s usable
3. Model Planning
- What it is: Once the data is ready, professionals decide which analysis methods or models to apply. This is a crucial step for determining how best to analyze the data.
- Key activities:
- Select appropriate analytical techniques (e.g., regression, clustering)
- Choose tools and algorithms to build models
- Define the scope of the model and approach
4. Model Building
- What it is: In this phase, the models selected in the previous step are actually created and tested. It’s where data professionals build the algorithms that will process the data.
- Key activities:
- Develop and execute models
- Test models to ensure they work as expected
- Fine-tune models for better performance
5. Communication of Results
- What it is: Once the models have been built and tested, the results need to be communicated to stakeholders. The insights should be presented in a clear, understandable way.
- Key activities:
- Present findings to decision-makers
- Create visualizations (graphs, charts) to illustrate insights
- Translate technical findings into actionable recommendations
6. Operationalize
- What it is: The final phase involves putting the model into production. It’s about applying the model to real-world situations and ensuring it contributes to business decisions.
- Key activities:
- Implement the model in operational systems
- Use the model to inform business decisions
- Monitor the model’s performance and update it as needed
Key Concepts in the Data Analytics Lifecycle
To fully understand the Data Analytics Lifecycle, it’s important to grasp a few key concepts that make this process effective:
- Iterative Process: The lifecycle isn’t linear. As new insights or data arise, the phases are revisited to refine and improve the models.
- Collaboration: Data scientists and engineers plus analysts work independently to fulfill their specific responsibilities across the life cycle process. The various project contributors contribute different capabilities with specialized expertise to achieve project success.
- Data-Driven Decisions: The lifecycle exists to enable organizations to make better decisions by leveraging their data resources properly. The process goes beyond counting figures since it delivers information that leads to practical solutions.
- Data Analytics Techniques: In various phases, professionals use techniques like regression, clustering, and predictive modeling to analyze and interpret the data.
Importance of the Data Analytics Lifecycle
Here’s why following the Data Analytics Lifecycle is so important:
- Improved Decision-Making: By following a structured approach, organizations can make informed decisions based on data rather than intuition or guesswork.
- Systematic Process: The lifecycle provides a clear, organized framework for tackling data problems, ensuring that nothing important is missed.
- Flexibility: Data professionals have the ability to go back to previous phases due to the iterative structure which adapts to business needs when new data or insights appear.
- Valuable Business Insights: The lifecycle helps businesses uncover insights that might not be obvious at first glance. This could involve identifying market trends or optimizing internal processes.
- Opportunity Identification: Through detailed analysis, the lifecycle can highlight opportunities for growth, customer engagement, and improvement in various business areas.
- Better Data Quality: The lifecycle ensures that data is handled with care, maintaining its integrity and ensuring it’s accurate for analysis.
After learning about data analytics lifecycle development we can explore multiple analytics methods which transform unprocessed data into practical insights for pattern detection and trend prediction purposes.

Data Analytics Techniques For D491 OA📝
Before looking deeper at extraction methods in data analysis we need to understand the Data Analytics Lifecycle thoroughly. Advanced methods serve as analytical instruments to interpret numerical data structures on which businesses need to base their data-driven choices.
This article will discuss crucial data analytics techniques through practical applications while revealing their operation mechanisms.
Understanding the Types of Data Analytics
Data analytics functions without a standardized solution for every situation. Each analytical approach has its specific function depending on the knowledge about data that researchers seek to acquire. There exist four different types of analytics which are predictive analytics prediction analytics descriptive analytics and diagnostic analytics:
- Descriptive Analytics:
- What it is: This technique focuses on summarizing and describing data. It’s all about understanding what has happened in the past.
- How it works: Descriptive analytics uses techniques like data aggregation and data mining to provide insights into historical data. It tells the story of past events, giving us a clear picture of how things were.
- Real-World Example: The retail company conducts descriptive analytics procedures to reveal monthly sales patterns for their top-selling products.
- What it is: This technique focuses on summarizing and describing data. It’s all about understanding what has happened in the past.
- Diagnostic Analytics:
- What it is: This type of analytics digs deeper into the data to understand why something happened.
- How it works: By exploring relationships and identifying patterns, diagnostic analytics helps pinpoint the causes behind trends. This often involves investigating root causes or correlations.
- Real-World Example: The diagnostic techniques help organizations solve sales drops through customer and market pattern analysis during specific sales periods.
- What it is: This type of analytics digs deeper into the data to understand why something happened.
- Predictive Analytics:
- What it is: Predictive analytics uses historical data to forecast what is likely to happen in the future.
- How it works: It involves using statistical models and algorithms to predict future outcomes based on past trends.
- Real-World Example: An e-commerce platform applies predictive analytics to calculate future product demand by exploring past sales data patterns.
- What it is: Predictive analytics uses historical data to forecast what is likely to happen in the future.
- Prescriptive Analytics:
- What it is: This technique goes beyond prediction—it recommends actions to help achieve the best possible outcome.
- How it works: Prescriptive analytics uses optimization techniques and simulations to suggest the most effective decisions or actions based on predicted outcomes.
- Real-World Example: By utilizing prescriptive analytics in traffic data and delivery times analysis the logistics company establishes optimized delivery routes for drivers.
- What it is: This technique goes beyond prediction—it recommends actions to help achieve the best possible outcome.
Each of these techniques plays a critical role in helping organizations make the most of their data and also your WGU D491 OA. But how exactly do we apply these techniques in practice? Let’s dive deeper into specific data analysis techniques.
Core Data Analysis Techniques
Several advanced methods available to data analysts let them investigate data more deeply to develop useful insights for decision-making. The techniques allow analysts to interpret complicated data collections when solving essential business questions.
Here’s an overview of some of the most commonly used techniques:
- Regression Analysis:
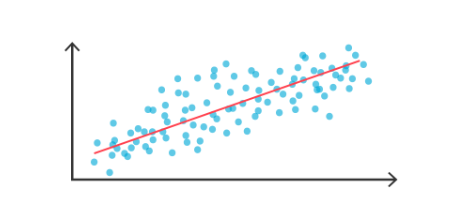
- What it is: Regression analysis is used to understand the relationship between one or more independent variables and a dependent variable.
- How it works: Through this approach researchers demonstrate how independent variables like marketing budget impact the dependent variable measure referred to as sales.
- Example: A company could use linear regression to predict sales based on factors like advertising spend, store location, and product pricing.
- What it is: Regression analysis is used to understand the relationship between one or more independent variables and a dependent variable.
- Cluster Analysis:
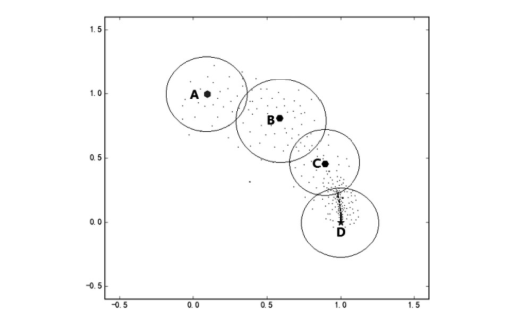
- What it is: The method organizes structurally identical data points to uncover patterns as well as separate data into significant groupings.
- How it works: Cluster analysis can be used to segment customers based on behavior, demographics, or purchasing patterns.
- Example: A business could use clustering to group customers into segments like “frequent shoppers,” “seasonal buyers,” or “first-time visitors.”
- What it is: The method organizes structurally identical data points to uncover patterns as well as separate data into significant groupings.
- Exploratory Data Analysis (EDA):
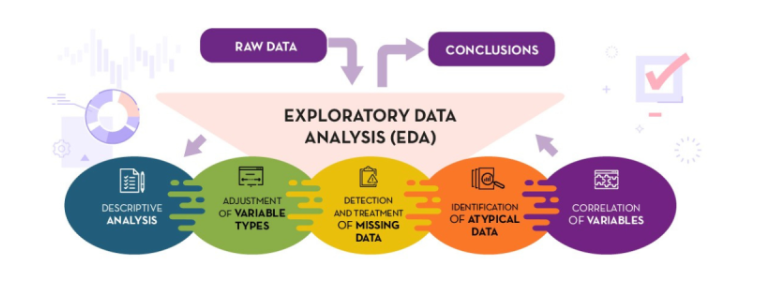
- What it is: EDA is the first step in analyzing data. It’s about finding patterns, detecting outliers, and testing assumptions.
- How it works: The data structure becomes visible through visualizations (scatter plots and histograms) combined with statistical techniques that EDA provides for analysis.
- Example: Before diving into predictive models, analysts use EDA to understand the distribution of variables in the dataset and determine the presence of any anomalies.
- What it is: EDA is the first step in analyzing data. It’s about finding patterns, detecting outliers, and testing assumptions.
- Factor Analysis:
- What it is: Factor analysis is used to reduce a large number of variables into a smaller set of factors that represent the underlying structure of the data.
- How it works: By combining correlated variables, factor analysis uncovers patterns that make the data easier to manage.
- Example: A company analyzing customer feedback might use factor analysis to identify the main drivers of satisfaction, such as product quality, customer service, and delivery speed.
- What it is: Factor analysis is used to reduce a large number of variables into a smaller set of factors that represent the underlying structure of the data.
The Role of Data Types in Analysis
The classification of data occurs between quantitative and qualitative distinctions. Analysis techniques require understanding their fundamental differences because this determines the correct selection.
Data Type | Description | Analysis Techniques |
Quantitative Data | Numerical data that can be measured. | Regression, predictive modeling, statistical analysis |
Qualitative Data | Non-numerical data that describes qualities or categories. | Text analysis, sentiment analysis, clustering |
- Quantitative Data: This type of data is numerical and can be measured. For example, sales figures or customer age.
- Techniques: Regression analysis, statistical modeling, predictive analytics.
- Example: Analyzing yearly revenue to predict future growth trends.
- Techniques: Regression analysis, statistical modeling, predictive analytics.
- Qualitative Data: This type of data involves descriptions, such as customer feedback or survey responses.
- Techniques: Text analysis, sentiment analysis, clustering.
- Example: Customer satisfaction levels about a product become clear through review analysis.
- Techniques: Text analysis, sentiment analysis, clustering.
We need to study the ARIMA model as a strong methodology that applies previous time series information to predict future trend patterns. Understanding these concepts will be helpful for your WGU D491 OA questions.
Tired of reading blog articles?
Let’s Watch Our Free WGU D491 Practice Questions Video Below!

The ARIMA Model For D491 OA📖
We can start our analysis of time-dependent data using one of the most effective methods which is the ARIMA model. Widely used in time series analysis stands the statistical technique which goes by the name of ARIMA. The forecasting method proves very useful when predicting future results from historical data trends while being exceptionally valuable for finance operations retail businesses and healthcare services as well as climate research projects.
The following section examines fundamental ARIMA model principles while explaining its parts, and methodology alongside real-world implementation examples.
Understanding the Basics of ARIMA
The ARIMA model churns out future data predictions through the examination of historical time-based information. Data collected at regular time intervals comprises time series data as shown by stock prices and monthly sales records and temperature measurements. ARIMA exhibits distinct capabilities for modeling time-based patterns which it applies to make future predictions.
- Time Series Analysis: ARIMA focuses specifically on dealing with data sets that follow a time sequence. The analysis of historical trends with seasonal variations and random fluctuations through Time Series analysis creates predictions for future trends.
- Core Idea: The model combines autoregressive (AR) terms, differencing (I), and moving average (MA) terms to forecast future values.
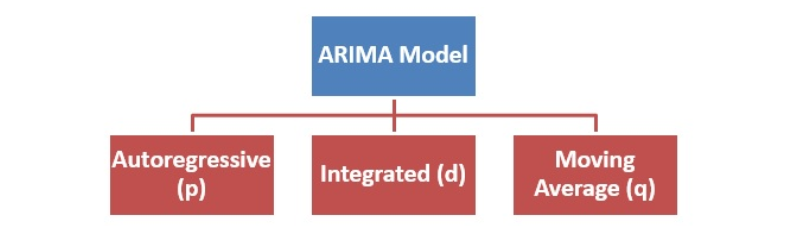
Components of the ARIMA Model
The ARIMA model is made up of three core components: Autoregression (AR), Integration (I), and Moving Average (MA). Let’s break these down:
- Autoregression (AR):
- Definition: The autoregressive component represents the relationship between an observation and a number of lagged (past) observations.
- Example: A stock price today may depend on stock prices from the last few days or weeks.
- Definition: The autoregressive component represents the relationship between an observation and a number of lagged (past) observations.
- Integrated (I):
- Definition: This module exists to convert data points that lack stability into stationary components. In stationary data patterns, the statistics remain consistent throughout time because their properties stay the same.
- How it works: Differencing is used to remove trends or seasonality, making the data stationary.
- Definition: This module exists to convert data points that lack stability into stationary components. In stationary data patterns, the statistics remain consistent throughout time because their properties stay the same.
- Moving Average (MA):
- Definition: The moving average component models the relationship between an observation and the residual errors from a moving average model applied to prior observations.
- Example: It helps smooth out short-term fluctuations and highlight longer-term trends in the data.
- Definition: The moving average component models the relationship between an observation and the residual errors from a moving average model applied to prior observations.
ARIMA Model Parameters: Understanding (p, d, q)
To build an ARIMA model, we need to define three parameters: p, d, and q. These parameters determine the structure of the model and influence how predictions are made.
Parameter | Description | Example |
p | The number of lag observations (autoregressive terms) | AR(1) would mean we use 1 previous value |
d | The degree of differencing (how many times data is differenced to make it stationary) | If data has a trend, d = 1 might be used to difference once |
q | The size of the moving average window (how many past errors are used) | MA(2) would mean we use the last two error terms |
- p: The number of past values that influence future predictions.
- d: The number of times we need to differentiate the data to make it stationary.
- q: The number of past errors included in the model.
By adjusting these parameters, ARIMA models can be tailored to a variety of time series datasets, helping make accurate predictions.
Stationarity and Differencing: Key Concepts
For an ARIMA model to work effectively, the data must be stationary. This means the statistical properties of the data should not change over time. If the data exhibits trends (e.g., an upward sales trajectory over time), the model will not perform well without transformation.
- Differencing: This is the technique used to make data stationary. It involves subtracting the current data point from the previous data point.
- Example: The data shows a 10-unit sales increase this month so differencing reduces this value from the previous month’s sales for analysis of change patterns.
- Example: The data shows a 10-unit sales increase this month so differencing reduces this value from the previous month’s sales for analysis of change patterns.
- Augmented Dickey-Fuller (ADF) Test: This test is used to check if the data is stationary. If the p-value is below a certain threshold, the data is considered stationary.

Your Data Analytics Journey: Wrapping Up with WGU D491 OA Insights and Best of Luck!📖
At the end of our comprehensive study about the Data Analytics Lifecycle and data analytics techniques together with the ARIMA model, you should understand how critical these fundamentals are to enhance your performance in WGU D491 OA. The understanding of these concepts prepares you to confront all questions presented in your final assessment and throughout your post-course learning journey.
Devote actual effort to thoroughly learn the concepts from our study sessions. The WGU D491 course moves beyond memorization of formulas or models because it teaches students to understand the problem-solving abilities of these tools which enable practical business choices. These professional capabilities acquired from WGU D491 will make you excel in the OA and produce success in any future data-focused career.
So, get ready to put your newfound knowledge to work! Good luck as you prepare for the WGU D491 OA—may your data be clean, your models precise, and your predictions spot on! You’ve got this!