

Corporate finance relies heavily on the Constant Growth Model which uses predicted future dividend amounts to calculate stock values. The model depends on perpetual dividend expansion which covers an infinite time period allowing them to make precise present-day stock price determinations. Achieve a present-day cost assessment for continually increasing revenue streams throughout the years. This methodology allows investors together with analysts to perform better stock value assessments.
Here’s the formula:
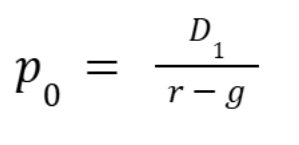
Where:
- P₀ = Price of the stock today
- D₁ = Expected dividend next year
- r = Required rate of return (the return investors expect for taking on the risk of owning the stock)
- g = Growth rate of dividends
Let’s break this down step by step.
Breaking Down the Key Components
- Dividends (D₁)
Companies share financial profits with shareholders through dividend payments that operate as the distribution of earnings to stockholders. The parameter D₁ represents the anticipated dividend payment that will reach investors in the upcoming year. When companies distributed $2 this year they plan to boost payments by 5% for next year’s dividend thus D₁ equals $2.10.
- Growth Rate (g)
The expected annual expansion pattern of dividend payments to shareholders is called the growth rate. Typically market dynamics alongside historical organizational financial performance help establish the value of stocks. Commercial entities demonstrating dividend growth at a 5% average annually in their history will most likely exhibit similar dividend expansion in the forthcoming period.
- Required Rate of Return (r)
This is the return investors expect for the risk of investing in the stock. It’s often calculated using the Capital Asset Pricing Model (CAPM), which considers factors like the risk-free rate and market volatility.
Why the Formula Works
The formula essentially calculates the present value of an infinite series of growing dividends. But here’s the catch: it only works if the required rate of return (r) is greater than the growth rate (g). If not, the formula produces unrealistic results.
Assumptions of the Constant Growth Model
To use the model effectively, we need to make a few key assumptions:
- Constant Growth Rate: For the model to apply dividends need to increase through an inevitably constant, foreseeable growth pattern. Stable mature companies would benefit from this model yet startup companies alongside high-growth firms would not receive favorable results.
- Stable Business Environment: The company’s operations and capital structure must remain consistent.
- Required Rate of Return > Growth Rate: This ensures the formula produces a meaningful stock price.
- Predictable Dividends: Dividends should be easy to estimate based on historical trends.
- Infinite Time Horizon: The model requires companies to persist indeterminately with dividend payouts.
The validity of this model largely depends on making these critical assumptions to define its appropriate application scenarios. This valuation method proves ineffective when used for a tech startup that has never distributed dividends to shareholders before.
Practical Applications
The Constant Growth Model is widely used in corporate finance for:
- Valuing Mature Companies: It’s perfect for companies with a long history of stable dividend payments, such as utility or consumer goods companies.
- Stock Selection: Investors use it to compare a stock’s intrinsic value (calculated with the model) to its market price, helping them decide if it’s overvalued or undervalued.
- Discounted Cash Flow (DCF) Analysis: The model establishes a method to determine terminal value which identifies the financial worth of extended cash flow streams extending past specific time frames.
- Sensitivity Analysis: Decision makers adjust growth projections as well as necessary return expectations to predict stock value changes across different potential situations.
Limitations of the Constant Growth Model
While the CGM is a powerful tool, it has its limitations:
- Rigid Assumptions: The assumption of constant dividend growth doesn’t hold for all companies, especially those in volatile industries.
- Inflation Impact: High inflation can distort growth rate and return estimates, making the model less reliable.
- Not Suitable for High-Growth Companies: The value of cash flows remains unclear for growing firms that do not pay dividends.
- Ignores Capital Structure Changes: Changes in debt or equity financing that alter dividend levels are not quantified in this model structure.
A Simple Example
Let’s apply the formula to a real-life scenario. Imagine a company pays a $3 dividend this year, expects to grow dividends by 4% annually, and investors require an 8% return.
Step 1: Calculate D1 (Next Year’s Dividend)
The current dividend (D0) is $3, and it is expected to grow by 4% next year:
D1 =D0(1+g)
D1 =3(1+0.04) =3x1.04 =3.12
Step 2: Plug Values into the Formula
Now substitute D1=3.12 , r=0.08 and g=0.04 into the formula:
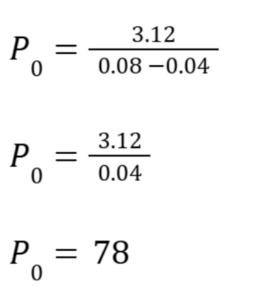
So, the stock’s value today is $78. If the market price is below this, the stock might be undervalued.
Final Answer
The price of the stock today (P0) is $78. This means the stock’s intrinsic value is $78 based on the given dividend growth and required return.
Study Tips For D362 OA
To master the Constant Growth Model, focus on:
- Time Value of Money (TVM): Understanding TVM concepts will make it easier to grasp why future dividends are discounted.
- Practice Problems: Use a financial calculator or software to practice CGM calculations.
- Conceptual Clarity: Memorizing the formula alone isn’t enough you should grasp its foundational principles.
Your mastery of these financial concepts will help you achieve WGU D362 academic success and develop the understanding necessary for analyzing real financial situations.


Financial science rests upon elements of Time Value of Money (TVM) since present-day money holds greater worth than similar amounts in future timeframes. This time-tested financial theory begins as an abstract principle that immediately converts into practical tools that measure investments and loan choices and guide financial choices. TVM represents an important WGU D362 concept which also frequently appears in WGU D362 OA questions.
What Is the Time Value of Money?
The basic idea behind TVM is simple: Money produces an increasing value from the present time to the future. A current dollar that becomes invested brings interest which increases its value beyond the initial amount in time. A $100 investment at a 5% yearly interest rate can grow to $105 during one year.
Why does this matter? TVM enables comparisons of monetary value across different periods which helps people make confident business choices.
Key Formulas in TVM
Let’s look at some of the fundamental formulas that help calculate TVM:
- Future Value (FV)
The future value tells you how much an investment will grow over a specific period.
FV = PV (1+r)n
Where:
- FV = Future Value
- PV = Present Value
- r = Interest Rate (decimal form)
- n = Number of Periods
For instance, if you invest $1,000 at a 6% annual interest rate for 5 years:
FV = 1000 (1+0.06)5
FV = 1000 (1.3380055776)
FV = 1338.23
- Present Value (PV)
The present value tells you how much a future sum of money is worth today.
For example, if you need $1,338 in 5 years and the interest rate is 6%, the amount you need to invest today is:
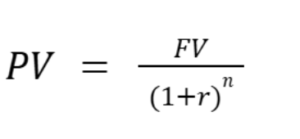
Where:
- FV = Future Value
- PV = Present Value
- r = Interest Rate (decimal form)
- n = Number of Periods
For example: If you need $1,338 in 5 years at an interest rate of 6%, the calculation would be:
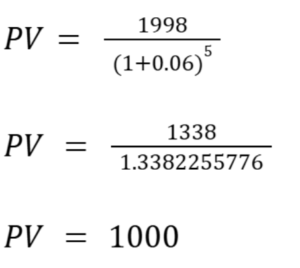
This shows you need to invest $1,000 today to have $1,338 in 5 years.
- Net Present Value (NPV)
This is used to evaluate investments by calculating the present value of future cash flows minus the initial investment.
![]()
Where:
- NPV = Net Present Value (overall value of the investment)
- CFₜ = Cash flow at time t
- C₀ = Initial investment
- r = Discount rate (interest rate per period)
- t = Time period (e.g., year 1, year 2, etc.)
NPV helps determine whether a project or investment is worthwhile. A positive NPV indicates a good investment.
Applications of TVM
TVM has countless real-world applications, making it an essential concept in both personal finance and corporate decision-making:
1. Investment Analysis
Investors use TVM to calculate the present value of future cash flows from an investment. This helps them determine whether an opportunity is worth pursuing.
2. Loan Amortization
Understanding TVM allows borrowers to see how much they’re paying in interest versus principal over the life of a loan. It also helps lenders structure repayment schedules.
3. Retirement Planning
To plan for retirement, individuals use TVM to calculate how much they need to save today to meet their future financial goals.
4. Business Valuation
Companies use TVM to value projects, acquisitions, and investments by estimating the present value of future cash flows.
Related Concepts
Compounding Frequency
Interest can be compounded annually, semi-annually, quarterly, or monthly. The more frequently interest is compounded, the greater the future value of an investment.
Inflation
Inflation erodes the purchasing power of money over time. For example, $100 today might only buy $90 worth of goods in ten years. TVM calculations often account for inflation to provide a more accurate financial picture.
Annuities
Annuities involve regular payments over time, such as monthly retirement benefits or loan repayments. TVM helps calculate their present and future values.
Study Tips For D362 OA
- Practice Calculations: Use financial calculators or spreadsheet software to solve TVM problems.
- Understand the Variables: Knowing how interest rates, compounding frequency, and time affect TVM is key.
- Connect to Real Life: Think about how TVM applies to loans, investments, and savings in your daily life.